Deflated Index Numbers: Consumer Price Index Numbers
1.अपस्फीतिक सूचकांक: उपभोक्ता मूल्य सूचकांक (Deflated Index Numbers: Consumer Price Index Numbers):
क्या आप सूचकांक ज्ञात करने में कठिनाई महसूस करते हैं? यदि हाँ,तो देखिए अपस्फीतिक सूचकांक (Deflated Index Numbers) को स्टेप-बाइ-स्टेप और सरल विधि से समझाने का तरीका।इसके साथ ही उपभोक्ता मूल्य सूचकांक के बारे में जानकारी प्राप्त करें।
Also Read This Article :- Consumer price index
2.अपस्फीतिक सूचकांक पर आधारित उदाहरण (Illustrations Based on Deflated Index Numbers):
Illustration:1.1956 में किसी सांख्यिकीय कार्यालय की ओर से 1950 के आधार पर एक उत्पादन सूचकांक प्राप्त किया गया जिसके परिणाम निम्नांकित हैं:
(In 1956, a statistical bureau started an index of production based on 1950, with the following results)
1966 में उक्त कार्यालय ने 1965 के आधार पर सूचकांक पुनर्निर्मित किया:
(In 1966, the bureau reconstructed the index on a plan with base 1965-%)
1972 से कार्यालय ने फिर 1971 को आधार-वर्ष मानते हुए सूचकांक का पुर्नानर्माण किया:
(In 1972, the bureau again reconstructed the index on yet another plan with the base year 1971)
तीन श्रेणियों का शिरोबन्धन करते हुए सतत सूचकांक श्रेणी ज्ञात कीजिए जिसका आधार-वर्ष 1971 हो । (Obtain a continuous series with the base 1971 by splicing the three series.)
[B. Com., Bombay, 1966]
Solution:Spliced Index Numbers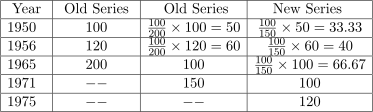
Illustration:2.निम्नलिखित सारणी एक अध्यापक की वार्षिक आय और 1950-58 के साधारण मूल्यों के सूचकांक प्रस्तुत करती है।अध्यापक की वास्तविक आय में परिवर्तन प्रकट करने वाले सूचकांक बनाइये:
(The following table presents the annual income of a teacher and simple price-indices for 1950-58.Construct index numbers to show changes in the real income of the teacher):
[B. Com., Meerut, 1972; Agra, 1975]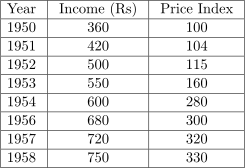
Solution:Calculation Table of Real Income Index Numbers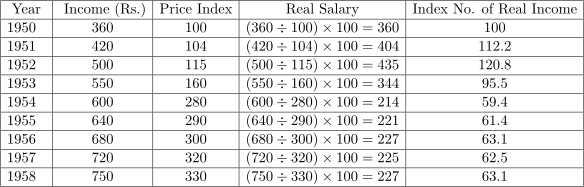
\text{Real salary Index No.} = \frac{\text{Real salary of current year}}{\text{Real salary of Base year}} \times 100
1951 = \frac{404}{360} \times 100 = 112.2
1952 = \frac{435}{360} \times 100 = 120.8
Similarly we find out other year’s Index No.

Illustration:3.एक निश्चित श्रमिक वर्ग की प्रति व्यक्ति आय और जीवन-निर्वाह व्यय सूचकांक निम्न सारणी में दिए गए हैं।निर्वाह-व्यय में होने वाली वृद्धि को ध्यान में रखते हुए प्रति व्यक्ति आय की अपस्फीति कीजिए और श्रमिकों की वास्तविक आय के सूचकांक भी ज्ञात कीजिए:
(The per capita income of a certain class of workers and cost of living index numbers ars given in the following table. Deflate the per capita income with reference to the cost of living index and also obtain index numbers of real income of workers):
[M. Com. Banaras,1909, M. A. Meerut, 1970 excluding the figures for 1966]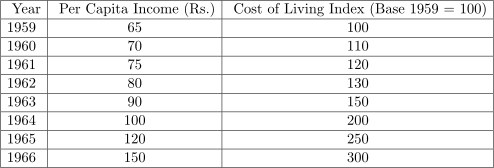
Solution:Calculation Table of Real Income Index Numbers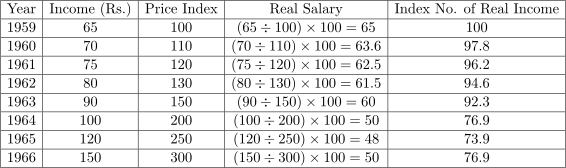
\text{Real salary Index No.} = \frac{\text{Real salary of current year}}{\text{Real salary of Base year}} \times 100
1960 = \frac{63.6}{65} \times 100 = 97.8
1961 = \frac{62.5}{65} \times 100 = 96.2
1962 = \frac{61.5}{65} \times 100 = 94.6
Similarly we can find out other year’s Index No.
Illustration:4.एक मजदूर की की वार्षिक मजदूरी (रु. में) मूल्य सूचकांकों के साथ दी गई है।मजदूरों की वास्तविक मजदूरी के सूचकांक ज्ञात कीजिए:
(The annual wages (in Rs.) of a worker are given along with price indices.Find the real wage Indices):
[B. Com, Raj., 1970]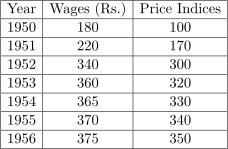
Solution:Calculation Table of Real Wages Index Numbers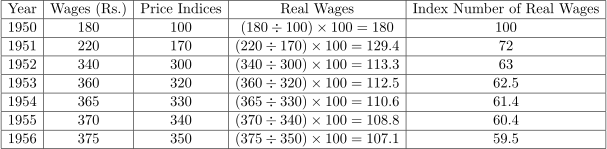
\text{Real salary Index No.} = \frac{\text{Real salary of current year}}{\text{Real salary of Base year}} \times 100
1951 = \frac{129.4}{180} \times 100 = 72
1952 = \frac{113.3}{180} \times 100 \approx 63
1953 = \frac{112.5}{180} \times 100 = 62.5
1954 = \frac{110.6}{180} \times 100 = 61.4
1955 = \frac{108.8}{180} \times 100 = 60.4
1956 = \frac{107.1}{180} \times 100 = 59.5
Illustration:5.निम्न समंकों से 1968 को आधार-वर्ष मानते हुए वास्तविक मजदूरी सूचकांक ज्ञात कीजिए:
(Compute the index numbers of real wages from the following data,taking 1968 as base year)
[M. Com., Delhi, 1970]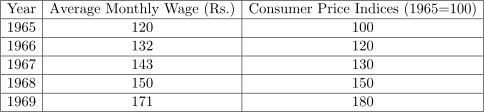
Solution:Calculation Table of Real Wages Index Numbers
\text{Real wages} = \frac{\text{Wages}}{\text{Price Index Number}} \times 100
\text{Real Wages Index No.} = \frac{\text{Real wages of current year}}{\text{Real wages of Base Year}} \times 100
1965 \to = \frac{120}{100} \times 100 = 120
1966 \to = \frac{110}{100} \times 100 = 110
1967 \to = \frac{110}{100} \times 100 = 110
1969 \to = \frac{95}{100} \times 100 = 95
उपर्युक्त उदाहरणों के हल द्वारा अपस्फीतिक सूचकांक: उपभोक्ता मूल्य सूचकांक (Deflated Index Numbers: Consumer Price Index Numbers) को समझ सकते हैं।
3.उपभोक्ता मूल्य सूचकांक पर आधारित उदाहरण (Illustrations Based on Consumer Price Index Numbers):
Illustration:6.निम्न सारणी में एक औसत भारतीय मजदूर के पारिवारिक बजट से सम्बन्धित वर्ग-सूचकांक और उनके भार दिए गए हैं।उपभोक्ता सूचकांक ज्ञात कीजिए:
(The following are the group index numbers and the group weights of an average working class family’s budget. Construct the Consumer Price Index Number
[I. C. W. A., 1970; M. Com, Vikram, 1968, B. Com., Agro, Lucknow, Bombay, 1967]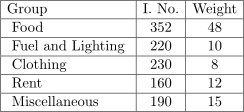
Solution:Consumer Price Index Numbers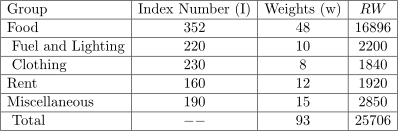
P_{01} = \frac{\sum RW}{\sum W} = \frac{25706}{93}
\implies P_{01} \approx 276.4

Illustration:7.निम्न समंकों से थोक मूल्य-सूचकांक ज्ञात कीजिए:
(From the following data, compute a wholesale price index number):
[M. Com., Calcutta,1970]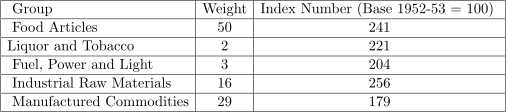
Solution:Consumer Price Index Numbers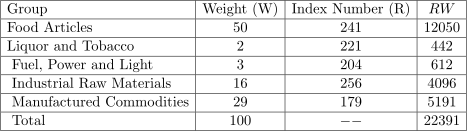
P_{01} = \frac{\sum RW}{\sum W} = \frac{22391}{100}
P_{01} \approx 223.9
Illustration:8.नीचे दिए हुए समंकों से 1971 के आधार पर 1976 के मूल्यों का सूचकांक निकालिए:
(From the following data, find index number for 1976, taking 1971 as base year):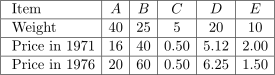
Solution: Calculation Table of consumer price Index Number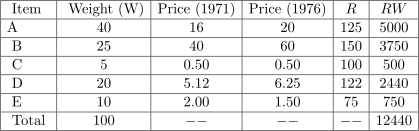
R = \frac{P_1}{P_0} \times 100
A \to = \frac{20}{16} \times 100 = 125
B \to = \frac{60}{40} \times 100 = 150
C \to = \frac{0.50}{0.50} \times 100 = 100
D \to = \frac{6.25}{5.12} \times 100 = 122
E \to = \frac{1.50}{2.00} \times 100 = 75
P_{01} = \frac{\sum RW}{\sum W} = \frac{12440}{100} = 124.4
उपर्युक्त उदाहरणों के हल द्वारा अपस्फीतिक सूचकांक: उपभोक्ता मूल्य सूचकांक (Deflated Index Numbers: Consumer Price Index Numbers) को समझ सकते हैं।
Also Read This Article :- Simple Average of Price Relative Method
4.छात्र-छात्राओं के लिए अपस्फीतिक सूचकांक: उपभोक्ता मूल्य सूचकांक के प्रैक्टिस प्रोब्लम्स (Practice Problems of Deflated Index Numbers: Consumer Price Index Numbers for Students):

(1.)निम्न सारणी एक अध्यापक का मासिक औसत वेतन और गत 8 वर्षों की अवधि के मूल्यों का सामान्य निर्देशांक बताती है :
(The following table gives the average monthly salary of a teacher and the general index of price during the last 8 years):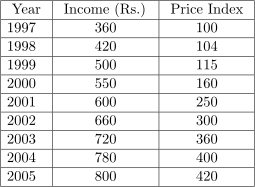
वास्तविक औसत वेतन और वर्ष 1997 के आधार पर वेतन सूचकांक ज्ञात कीजिए।
(Find the real average monthly income and its index numbers taking 1997 as base.)
(2.)निम्नलिखित तथ्यों से 2004 वर्ष के लिए 2002 को आधार वर्ष मानते हुए उपभोक्ता मूल्य सूचकांक (i) समूह व्यय विधि, तथा (ii) पारिवारिक बजट विधि को काम में लेते हुए तैयार कीजिए:
(Construct the Consumer Price Index for the year 2004 on the basis of 2002 from the following data using (i) Aggregate Expenditure Method and (ii) Family Budget Method):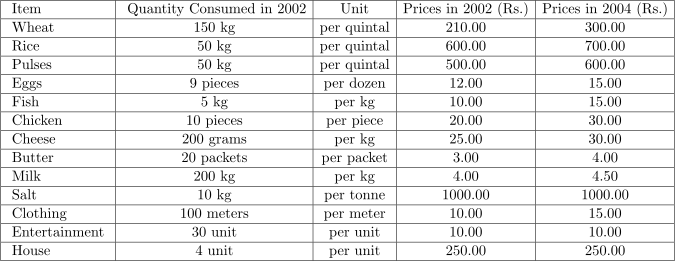
यदि पारिवारिक बजट में विभिन्न मदों का महत्त्व निम्न वर्णित भारानुसार हो तो क्या परिणाम में कोई अन्तर होगा?
(Suppose the importance of various items in the family budget are given as below. will there be any difference in the result?)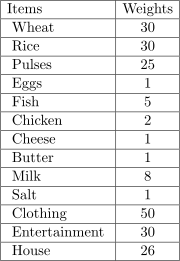
उत्तर (Answers):(1.)Real Income:360,404,435,344,240,220,200,195,193 Index Nos. 100,112.2,120.8,95.6,66.7,61.1,55.6,54.2,53.6
(2.)126.78,128.71
उपर्युक्त सवालों को हल करने पर अपस्फीतिक सूचकांक: उपभोक्ता मूल्य सूचकांक (Deflated Index Numbers: Consumer Price Index Numbers) को अच्छी तरह से समझ सकते हैं क्योंकि स्वयं प्रैक्टिकल रूप से सवालों को हल करने पर कांसेप्ट अच्छी तरह समझ में आती है।
### 📢 यदि आपको यह गणित का आर्टिकल पसंद आया हो:
* 👥 **मित्रों के साथ शेयर करें:** ज्ञान बांटने से बढ़ता है,इसलिए इसे अपने दोस्तों के साथ ज़रूर साझा करें।
* 🔔 **वेबसाइट को फॉलो करें:** अगर आप यहाँ पहली बार आए हैं, तो हमारे **ईमेल सब्सक्रिप्शन** को फॉलो करें।साथ ही, **Push Notification (घंटी के आइकॉन) को भी अलाउ (Allow) करें** ताकि हर नए ज़रूरी आर्टिकल और टेस्ट सीरीज़ का नोटिस आपके मोबाइल पर तुरंत मिल जाए!
* 💬 **अपने सुझाव दें:** यदि आपकी कोई समस्या है या कोई सुझाव देना चाहते हैं,तो नीचे **कमेंट** करके हमें ज़रूर बताएं।
**पूरा आर्टिकल पढ़ने के लिए आपका स्वागत है!** 🙏
Also Read This Article:- How to Find Index Number by Chain Base Method?
5.अपस्फीतिक सूचकांक: उपभोक्ता मूल्य सूचकांक (Frequently Asked Questions Related to Deflated Index Numbers: Consumer Price Index Numbers) से सम्बन्धित अक्सर पूछे जाने वाले प्रश्न:
प्रश्न:1.उपभोक्ता मूल्य सूचकांक ज्ञात करने की कौन-कौनसी विधियाँ हैं?
उत्तर:(1.)भारित व्यय विधि या भारित समूही व्यय विधि (Aggregate Expenditure Method or Weighted Aggregative Method)
(2.)भारित मूल्यानुपात विधि या पारिवारिक बजट विधि (Weighted Average of Relatives Method or Family Budget Method)
प्रश्न:2.उपभोक्ता मूल्य सूचकांक ज्ञात करने का सूत्र लिखो। (Write the Formula to Find the Consumer Price Index Number):
उत्तर:(1.)भारित व्यय विधि या भारित समूही व्यय विधि का सूत्र (Formula of Aggregate Expenditure Method or Weighted Aggregative Method)
P_{01} = \frac{\sum p_1 q_0}{\sum p_0 q_0} \times 100
(2.)भारित मूल्यानुपात विधि या पारिवारिक बजट विधि का सूत्र (Formula of Weighted Average of Relatives Method or Family Budget Method)
P_{01} = \frac{\sum RW}{\sum W}
प्रश्न:3.अपस्फीतिक सूचकांक ज्ञात करने का सूत्र लिखो। (Write the Formula to Find the Deflated Index Number):
उत्तर: Real Income or Real Wages
\text{Real Income or Real Wages} = \frac{\text{Money Income or wages}}{\text{Price Index Number}} \times 100
Index No. of Real Income or deflated Index Numbers
\text{Index No. of Real Income or deflated Index Numbers} = \frac{\text{Real income of current year}}{\text{Real income of Base Year}} \times 100
उपर्युक्त प्रश्नों के उत्तर द्वारा अपस्फीतिक सूचकांक: उपभोक्ता मूल्य सूचकांक (Deflated Index Numbers: Consumer Price Index Numbers) की प्राइमरी टर्म्स के बारे में जान सकते हैं।
6.छात्र-छात्राओं से आज का प्रश्न (Today’s Question to Students):
🎯 विनर्स कॉर्नर:क्या आप इस सवाल का सही जवाब दे सकते हैं?अपने नाम के साथ नीचे कमेंट करें!सही जवाब देने वाले Top Students के नाम हमारी आगे post/is article ke update में Photo ya Special Mention के साथ publish की जाएगी।अपना जवाब अभी दर्ज करें!👇
*”एक रेलगाड़ी दो स्टेशनों के बीच की दूरी 1 घण्टे में तय करती है।यदि रेलगाड़ी की चाल 10 किमी/घण्टा बढ़ जाए तो वह उसी दूरी को कितने समय में तय कर लेगी?”*
(A train covers the distance between two stations in 1 hour. If the speed of the train increases by 10 km/hr, in how much time will it cover the same distance?)
*पिछली प्रश्नोत्तरी का हल*
उस महिला के पुत्री,परिचय कराये जाने वाले व्यक्ति के पिता की पुत्री अर्थात् बहन हुई।अतः वह व्यक्ति उस महिला का पुत्र हुआ।
*Previous Quiz Solution*
The daughter of the woman became the daughter of the father of the person to be introduced, i.e. sister. Hence, that person became the son of that woman.
*”यह आर्टिकल **Satyam Mathematics** ब्लॉग पर **Satyam Coaching Centre** के द्वारा तैयार किया गया है।”*





About Author

Sanjay Kumawat
(1.)**Satyam Narain Kumawat** **Website Name:Satyam Mathematics** *Owner:satyamcoachingcentre.in* *Sthan:Manoharpur,Jaipur (Rajasthan)* **Teaching Mathematics aur Anya Anubhav** ***Shiksha:**B.sc.,B.Ed.,(M.sc. star Ke Mathematics Ko Padhane ka Anubhav),B.com.,M.com. Ke vishayon Ko Padhane ka Anubhav,Philosophy,Psychology,Religious,sanskriti Mein Gahri Ruchi aur Adhyayan ***Anubhav:**phichale 23 varshon se M.sc.,M.com.,Angreji aur Vigyan Vishayon Mein Shikshaka Ka Lamba Anubhav ***Visheshagyata:*Maths,Adhyatma (spiritual),Yog vishayon ka vistrit Gyan* ****In Brief:I have read about M.sc. books,psychology,philosophy,spiritual, vedic,religious,yoga,health and different many knowledgeable books.A dedicated math expert with 23+ years of teaching experience upto M.sc. ,M.com.,English and science.After guiding thousands of students through Satyam Coaching Center,now share Mathematics,Trigonometry (Upto M.sc) and Educational Strategies in simple language on this blog from December 2018.* (2.)**(Technical Expert & Co-Admin):** ***Name:Sanjay Kumawat* *Qualification:Graduate in Mechanical Engineering (B.Tec) in 2013* *Profession:Physics Lecturer* *Teaching Experience:15 Years and Teaching to NEET,JEE Students* *Technical Experience:5 Years Coding and Article Editing,Classic Photo Editing by Laptop in Satyam Coaching Centre Blog* *A school lecturer and digital content strategist.On this blog,he handles all the responsibility of coding,image editing,SEO, and technical management,so that the mathematical content reaches the readers in a very accurate and beautiful form.* Updated on 15.06.2026

