Fisher’s Ideal Index Number
1.फिशर का आदर्श सूचकांक (Fisher’s Ideal Index Number):

फिशर का आदर्श सूचकांक (Fisher’s Ideal Index Number) के द्वारा जानिए कैसे सूचकांक ज्ञात किया जाता है? मूल्य और मात्रा दी गई हो तो आदर्श सूचकांक कैसे ज्ञात किया जाए,स्टेप-बाइ-स्टेप डिटेल्स।
Also Read This Article:- Price index
2.फिशर का आदर्श सूचकांक के साधित उदाहरण (Fisher’s Ideal Index Number Solved Illustrations):
Illustration:1.निम्नांकित सूचना से (i)समूही व्यय रीति द्वारा, तथा (ii)पारिवारिक बजट रीति द्वारा मार्च 1975 के आधार पर मार्च 1976 और मार्च 1977 के लिए उपभोक्ता मूल्य सूचकांक परिकलित कीजिए:
(From the following information,calculate consumer price index numbers for march 1976 and march 1977 on the base of march 1975 by (i)aggregate expenditure method and (ii)family budget method):
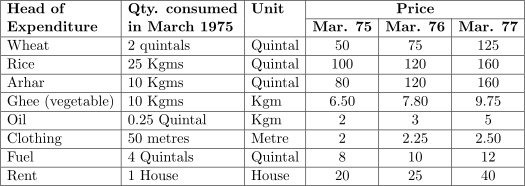
Solution:Calculation Table of Consumer Price Index Number
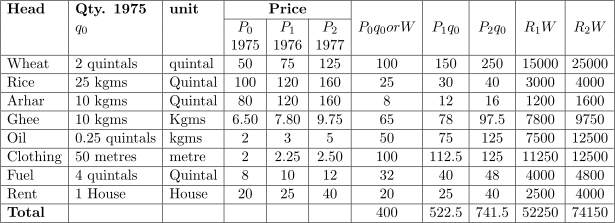
\text{(i)}
\text{Consumer Index Number of } 1976 = \frac{\sum P_1 q_0}{\sum P_0 q_0} \times 100 \\
= \frac{522.5}{400} \times 100 \approx 130.6 \\
\text{Consumer Index Number of } 1977 = \frac{\sum P_1 q_0}{\sum P_0 q_0} \times 100 \\
= \frac{741.5}{400} \times 100 \approx 185.4 \\
\text{(ii)}
R = \frac{P_1}{P_0} \times 100 \\
\text{1976} \rightarrow \frac{75}{50} \times 100 = 150,\quad \frac{120}{100} \times 100 = 120,\quad \frac{120}{80} \times 100 = 150, \\
\frac{7.80}{6.50} \times 100 = 120,\quad \frac{3}{2} \times 100 = 150, \\
\frac{2.25}{2} \times 100 = 112.5,\quad \frac{10}{8} \times 100 = 125, \\
\frac{25}{20} \times 100 = 125 \\ \text{1977} \rightarrow \dfrac{125}{50} \times 100 = 250 , \dfrac{160}{100} \times 100 = 160 ,\dfrac{160}{80} \times 100 = 200 \\
\dfrac{9.75}{6.50} \times 100 = 150 , \dfrac{5}{2} \times 100=250, \dfrac{2.50}{2} \times 100 = 125 \\ \dfrac{12}{8} \times 100 = 150 , \dfrac{40}{20} \times 100 = 200 \\ \textbf{\text{Consumer Index Number 1976}} \\
\text{Consumer Index Number by family budget method} \\
\text{1976:} \quad = \frac{\sum R_1 W}{\sum W} = \frac{52250}{400} = 130.625 \\
\approx 130.6 \\
\text{1977:} \quad \frac{\sum R_2 W}{\sum W} = \frac{74150}{400} \approx 185.4
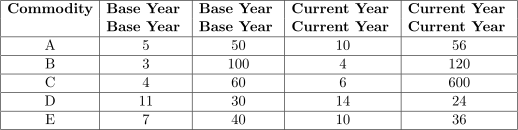
Illustration:2.निम्न समंकों से फिशर का आदर्श सूचकांक परिगणित कीजिए:
(From the following data,calculate Fisher’s Ideal index number):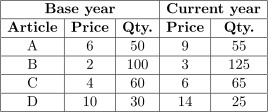
Solution:Calculation Table of Fisher’s Price Index Number
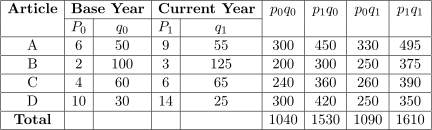
Illustration:3.फिशर के ‘आदर्श’ सूत्र का प्रयोग करके निम्न सामग्री से मात्रा सूचकांक परिकलित कीजिए:
(Using Fisher’s ‘Ideal’ formula,calculate the quantity index number from the following data):
Solution:Calculation Table of Fisher’s Price Index Number
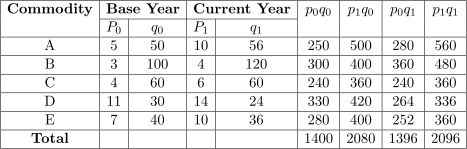
\textbf{\text{Fisher's Ideal Index No.}} \\
= \sqrt{\frac{\sum P_1 q_0}{\sum P_0 q_0} \times \frac{\sum P_1 q_1}{\sum P_0 q_1}} \times 100 \\
= \sqrt{\frac{2080}{1400} \times \frac{2096}{1396}} \times 100 \\
= \sqrt{\frac{435968}{195440}} \times 100 \\
= 1.4935 \times 100 \\
= 149.35
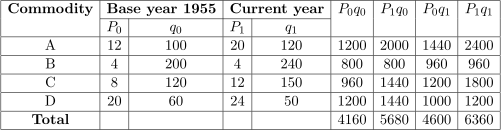
Illustration:4.निम्नलिखित समंकों का उपयोग करते हुए 1955 के आधार पर 1965 के लिए एक उपयुक्त सूचकांक ज्ञात कीजिए:
(Compute a suitable index number for 1965 on the base year 1955 with the help of following data):
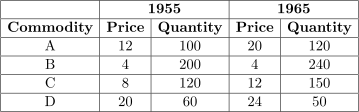
Solution:Calculation Table of Fisher’s Price Index Number
\textbf{\text{Fisher's Ideal Index No.}} \\
= \sqrt{\frac{\sum P_1 q_0}{\sum P_0 q_0} \times \frac{\sum P_1 q_1}{\sum P_0 q_1}} \times 100 \\
= \sqrt{\frac{5680}{4160} \times \frac{6360}{4600}} \times 100 \\
= \sqrt{\frac{361248}{191360}} \times 100 \\
\approx 1.3739 \times 100 \\
\approx 137.4
Illustration:5.’समय उत्क्राम्यता परीक्षा’ और ‘खण्ड उत्क्राम्यता परीक्षा’ की स्पष्ट व्याख्या कीजिए।1969 को आधार वर्ष मानते हुए अग्र समंकों की सहायता से यह दर्शाइए कि दोनों परीक्षण फिशर के आदर्श सूचकांक पर उतरते हैं:
(With the help of following data and talking 1969 as base year,show that both reversal tests are satisfied by Fisher’s ideal index number)
Solution:Calculation Table of Fisher’s Price Index Number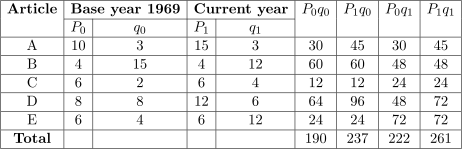
P_{01} = \sqrt{\frac{\sum P_1 q_0}{\sum P_0 q_0} \times \frac{\sum P_1 q_1}{\sum P_0 q_1}} \times 100 \\
= \sqrt{\frac{237}{190} \times \frac{261}{222}} \times 100 \\
= \sqrt{\frac{61857}{42180}} \times 100 \\
\approx 1.2109 \times 100 \\
\approx 121.09 \\
\textbf{\text{समय उत्क्राम्यता}} \\
P_{01} \times P_{10} = \sqrt{\frac{\sum P_0 q_0}{\sum P_1 q_0} \times \frac{\sum P_0 q_1}{\sum P_1 q_1} \times \frac{\sum P_1 q_0}{\sum P_0 q_0} \times \frac{\sum P_1 q_1}{\sum P_0 q_1}} = 1 \\
\textbf{\text{खण्ड उत्क्राम्यता}} \\
Q_{01} = \sqrt{\frac{\sum P_0 q_1}{\sum P_0 q_0} \times \frac{\sum P_1 q_1}{\sum P_1 q_0}} \\
= \sqrt{\frac{222}{190} \times \frac{261}{237}}\\
P_{01} \times Q_{01} = \sqrt{\frac{\sum P_0 q_1}{\sum P_0 q_0} \times \frac{\sum P_1 q_1}{\sum P_1 q_0} \times \frac{\sum P_1 q_0}{\sum P_0 q_0} \times \frac{\sum P_1 q_1}{\sum P_0 q_1}} \\
\Rightarrow P_{01} \times Q_{01} = \frac{\sum P_1 q_1}{\sum P_0 q_0} = \frac{261}{190}
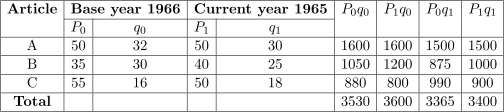
Illustration:6.निम्न समंक कुछ वस्तुओं की कीमतों और मात्राओं से सम्बन्धित हैं।एक उपयुक्त-सूचकांक की रचना कीजिए कि यह सूचकांक समय उत्क्राम्यता परीक्षा पूर्ण करता है या नहीं:
(The following data relate to price and quantities of some commodities.Construct a suitable index number and examine if it is satisfies the time reversal test):
Solution:Calculation Table of Fisher’s Price Index Number
P_{01} = \sqrt{\frac{\sum P_1 q_0}{\sum P_0 q_0} \times \frac{\sum P_1 q_1}{\sum P_0 q_1}} \times 100 \\
= \sqrt{\frac{3600}{3530} \times \frac{3400}{3365}} \times 100 \\
= \sqrt{\frac{1224000}{1187845}} \times 100 \\
\approx 1.0151 \times 100 \\
P_{01} \approx 101.51 \\
\textbf{\text{समय उत्क्राम्यता}}\\
P_{01} \times P_{10} = \sqrt{\frac{\sum P_1 q_0}{\sum P_0 q_0} \times \frac{\sum P_1 q_1}{\sum P_0 q_1} \times \frac{\sum P_0 q_0}{\sum P_1 q_0} \times \frac{\sum P_0 q_1}{\sum P_1 q_1}} \\ \Rightarrow P_{01} \times P_{10}=1
उपर्युक्त उदाहरणों के हल द्वारा फिशर का आदर्श सूचकांक (Fisher’s Ideal Index Number) को समझ सकते हैं।
Also Read This Article:- Consumer Price Index No.
3.प्रैक्टिस क्वेश्चंस (Practice Questions):

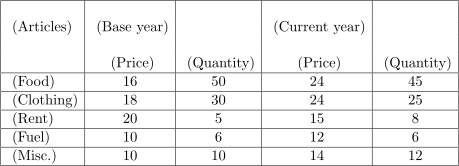
(1.)निम्न तालिका से फिशर का आदर्श सूचकांक की रचना कीजिए:
(Contruct Fisher’s ideal no. from the following table):
(2.)निम्नलिखित समंकों से फिशर के आदर्श सूचकांक की गणना कीजिए:
(Calculate Fisher’s ideal index no. from the following data):
वस्तुएं (Articles) व्यय (रुपये में) Exp (in Rs.) मूल्य (रुपये में) Price (in Rs.) व्यय (रुपये में) Exp (in Rs.) मूल्य (रुपये में) Price (in Rs.)
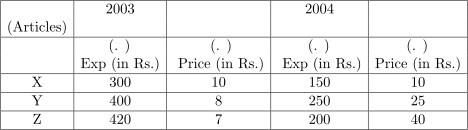
उत्तर (Answers): (1.) P_{01}=136.5 (2.)P_{01}=282.6
उपर्युक्त सवालों को हल करने पर फिशर का आदर्श सूचकांक (Fisher’s Ideal Index Number) को अच्छी तरह से समझ सकते हैं क्योंकि स्वयं प्रैक्टिकल रूप से सवालों को हल करने पर कांसेप्ट अच्छी तरह समझ में आती है।
### 📢 यदि आपको यह गणित का आर्टिकल पसंद आया हो:
* 👥 **मित्रों के साथ शेयर करें:** ज्ञान बांटने से बढ़ता है,इसलिए इसे अपने दोस्तों के साथ ज़रूर साझा करें।
* 🔔 **वेबसाइट को फॉलो करें:** अगर आप यहाँ पहली बार आए हैं, तो हमारे **ईमेल सब्सक्रिप्शन** को फॉलो करें।साथ ही, **Push Notification (घंटी के आइकॉन) को भी अलाउ (Allow) करें** ताकि हर नए ज़रूरी आर्टिकल और टेस्ट सीरीज़ का नोटिस आपके मोबाइल पर तुरंत मिल जाए!
* 💬 **अपने सुझाव दें:** यदि आपकी कोई समस्या है या कोई सुझाव देना चाहते हैं,तो नीचे **कमेंट** करके हमें ज़रूर बताएं।
**पूरा आर्टिकल पढ़ने के लिए आपका स्वागत है!** 🙏
Also Read This Article:- Deflated Index Numbers: Consumer Price Index Numbers
4.फिशर का आदर्श सूचकांक (Frequently Asked Questions Related to Fisher’s Ideal Index Number) से सम्बन्धित अक्सर पूछे जाने वाले प्रश्न:
प्रश्न:1.फिशर का आदर्श सूचकांक सूत्र (Fisher’s Ideal Index Number Formula):
उत्तर: P_{01} = \sqrt{\frac{\sum P_1 q_0}{\sum P_0 q_0} \times \frac{\sum P_1 q_1}{\sum P_0 q_1}} \times 100
प्रश्न:2.समय उत्क्राम्यता परीक्षण (Time Reversal Test):
उत्तर: P_{01} = \frac{1}{P_{10}} \Rightarrow P_{01} \times P_{10} = 1
प्रश्न:3.तत्त्व उत्क्राम्यता परीक्षण (Factor Reversal Test):
उत्तर: P_{01} \times Q_{01} = \frac{\sum P_1 q_1}{\sum P_0 q_0}
उपर्युक्त प्रश्नों के उत्तर द्वारा फिशर का आदर्श सूचकांक (Fisher’s Ideal Index Number) की प्राइमरी टर्म्स के बारे में जान सकते हैं।
5.छात्र-छात्राओं से आज का प्रश्न (Today’s Question to Students):
🎯 विनर्स कॉर्नर:क्या आप इस सवाल का सही जवाब दे सकते हैं?अपने नाम के साथ नीचे कमेंट करें!सही जवाब देने वाले Top Students के नाम हमारी आगे post/is article ke update में Photo ya Special Mention के साथ publish की जाएगी।अपना जवाब अभी दर्ज करें!👇
*”एक व्यक्ति ने 20,000 रुपये की दर से दो कार बेची (प्रत्येक 20000 रूपये में बेची)।एक पर उसे 25% का लाभ और दूसरे पर 20% की हानि होती है तो कुल लाभ या हानि बताएं।”*
(A man sold two cars at the rate of Rs. 20,000 (sold for Rs. 20000 each). If he makes a profit of 25% on one and a loss of 20% on the other, then what is the total profit or loss?)
*पिछली प्रश्नोत्तरी का हल*
उत्तर-कम्प्यूटर शब्द की उत्पत्ति अंग्रेजी के कम्प्यूट (Compute) शब्द से मानी जाती है जिसका अर्थ ‘गणना करना’ है अर्थात् कम्प्यूटर एक ऐसा संगणक या विश्लेषक है, जो गणितीय तथा अगणितीय सभी प्रकार की सूचनाओं का विश्लेषण करता है. तकनीकी दृष्टि से कम्प्यूटर के निम्नलिखित चार कार्य हैं:
(i) डेटा संकलन.
(ii) डेटा संचयन..
(iii) डेटा संसाधन
(iv) डेटा निर्गमन या पुनर्निर्गमन
कम्प्यूटर के मुख्यतः तीन अवयव होते हैं-
(i) हार्डवेयर.
(ii) सॉफ्टवेयर
(iii) ह्यूमेनवेयर.
इसके अतिरिक्त कम्प्यूटर में तीन ही इकाइयाँ होती हैं, जो निम्नलिखित हैं-
(i) केन्द्रीय संसाधन इकाई (Control Processing Unit)
(ii) निवेश/निर्गम इकाई (Input or Output Unit)
(iii) स्मृति इकाई (Memory Unit).
*Previous Quiz Solution*
Answer: The word computer is believed to be derived from the English word compute, which means ‘to calculate’, that is, a computer is a computer or analyzer, which analyzes all types of information, mathematical and non-mathematical information. From a technical point of view, the computer has the following four functions:
(i) Data collection.
(ii) Data Storage.
(iii) Data Processing
(iv) Data output or inputut
There are three main components of a computer:
(i) Hardware.
(ii) Software
(iii) Humanware.
Apart from this, there are only three units in the computer, which are as follows:
(i) Central Processing Unit
(ii) Input or Output Unit
(iii) Memory Unit.
*”यह आर्टिकल **Satyam Mathematics** ब्लॉग पर **Satyam Coaching Centre** के द्वारा तैयार किया गया है।”*




About Author

Sanjay Kumawat
(1.)**Satyam Narain Kumawat** **Website Name:Satyam Mathematics** *Owner:satyamcoachingcentre.in* *Sthan:Manoharpur,Jaipur (Rajasthan)* **Teaching Mathematics aur Anya Anubhav** ***Shiksha:**B.sc.,B.Ed.,(M.sc. star Ke Mathematics Ko Padhane ka Anubhav),B.com.,M.com. Ke vishayon Ko Padhane ka Anubhav,Philosophy,Psychology,Religious,sanskriti Mein Gahri Ruchi aur Adhyayan ***Anubhav:**phichale 23 varshon se M.sc.,M.com.,Angreji aur Vigyan Vishayon Mein Shikshaka Ka Lamba Anubhav ***Visheshagyata:*Maths,Adhyatma (spiritual),Yog vishayon ka vistrit Gyan* ****In Brief:I have read about M.sc. books,psychology,philosophy,spiritual, vedic,religious,yoga,health and different many knowledgeable books.A dedicated math expert with 23+ years of teaching experience upto M.sc. ,M.com.,English and science.After guiding thousands of students through Satyam Coaching Center,now share Mathematics,Trigonometry (Upto M.sc) and Educational Strategies in simple language on this blog from December 2018.* (2.)**(Technical Expert & Co-Admin):** ***Name:Sanjay Kumawat* *Qualification:Graduate in Mechanical Engineering (B.Tec) in 2013* *Profession:Physics Lecturer* *Teaching Experience:15 Years and Teaching to NEET,JEE Students* *Technical Experience:5 Years Coding and Article Editing,Classic Photo Editing by Laptop in Satyam Coaching Centre Blog* *A school lecturer and digital content strategist.On this blog,he handles all the responsibility of coding,image editing,SEO, and technical management,so that the mathematical content reaches the readers in a very accurate and beautiful form.* Updated on 15.06.2026

